XTronic
XTronic
XTronic takes care of the measurements with Xstress systems from running the measurement to calculating the residual stress or retained austenite values. XTronic software fulfills the new European X-ray residual stress testing standard EN 15305.
Measurement tools easily available
XTronic has a powerful graphical interface. Setting up the parameters and creating and executing a new measurement is quick and easy even for measuring complex shaped samples. Measurement and data handling tools are easily accessible in main and measurement toolbars. These toolbars can be hidden and moved according to your needs. Connections, X-ray tubes and operation power of the system are managed with the X-ray control tool. X-ray control side bar provides one quick and convenient access to all tools for starting the measurement. If not needed, the X-ray control side bar can be hidden, e.g. to make more room for the measurement information and result windows.
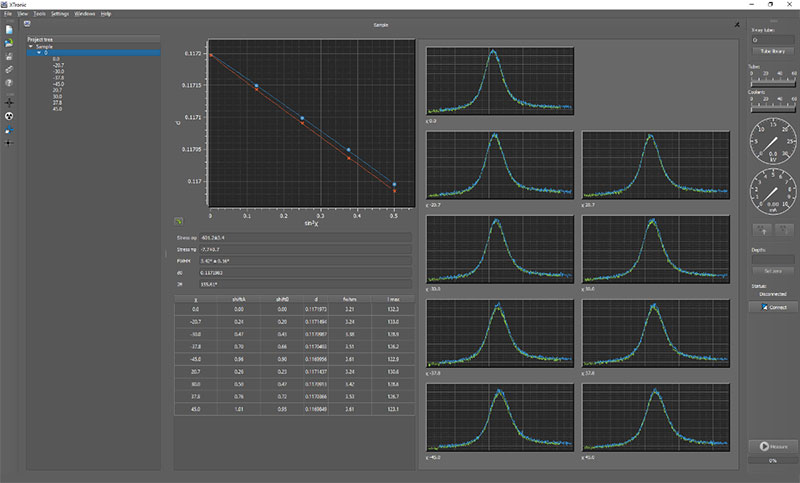
Real-time measurement data
All relevant measurement data is visible real time on the measurement window. You can easily view intensity distributions in different stages of analysis and in different scales. The software updates the graphs and calculation results after each finished measurement stage. You can also view all other possible graphics from d-sin2χ distributions and stress distributions to graphs of mapping projects by couple of simple mouse clicks. Autosave option helps to make sure you do not loose your measurements.
XTronic supports stress measurement in the modified χ as well as in ω mode. While the modified χ mode is the most commonly used, sample geometry can make it impossible or impractical. Then ω mode is the better option, e.g. for measuring a gear root in axial direction.
Measurement settings are easy to access, make and modify as they are all visible at the same time in one window.
The Project tool allows you to combine multiple stress or austenite measurements and automatically generates graphs and tables of the results. Typical uses are depth profiles, e.g. of shot-peened surfaces or stress distributions across weld seams. Each project can include several measurement series. The Project tool is fully integrated into the software, requires very little extra effort and makes access to the data much easier. Graphs tab contains for example depth profile graph including all the measurements made for the series. Stress profile graphs can be viewed in details e.g. with error bars.
Among many different calculation methods the advanced peak fit method can be used to calculate residual stress and retained austenite values.


